Here I explain how to make an animation with appearing objects.
This is more complex and requires the use events and movie modules.
In this example, I create an animation showing the occurrences of earthquakes during the year 2018 (with one frame per day).
Note that the earthquakes are drawn as they occur and remain visible until the end of the animation.
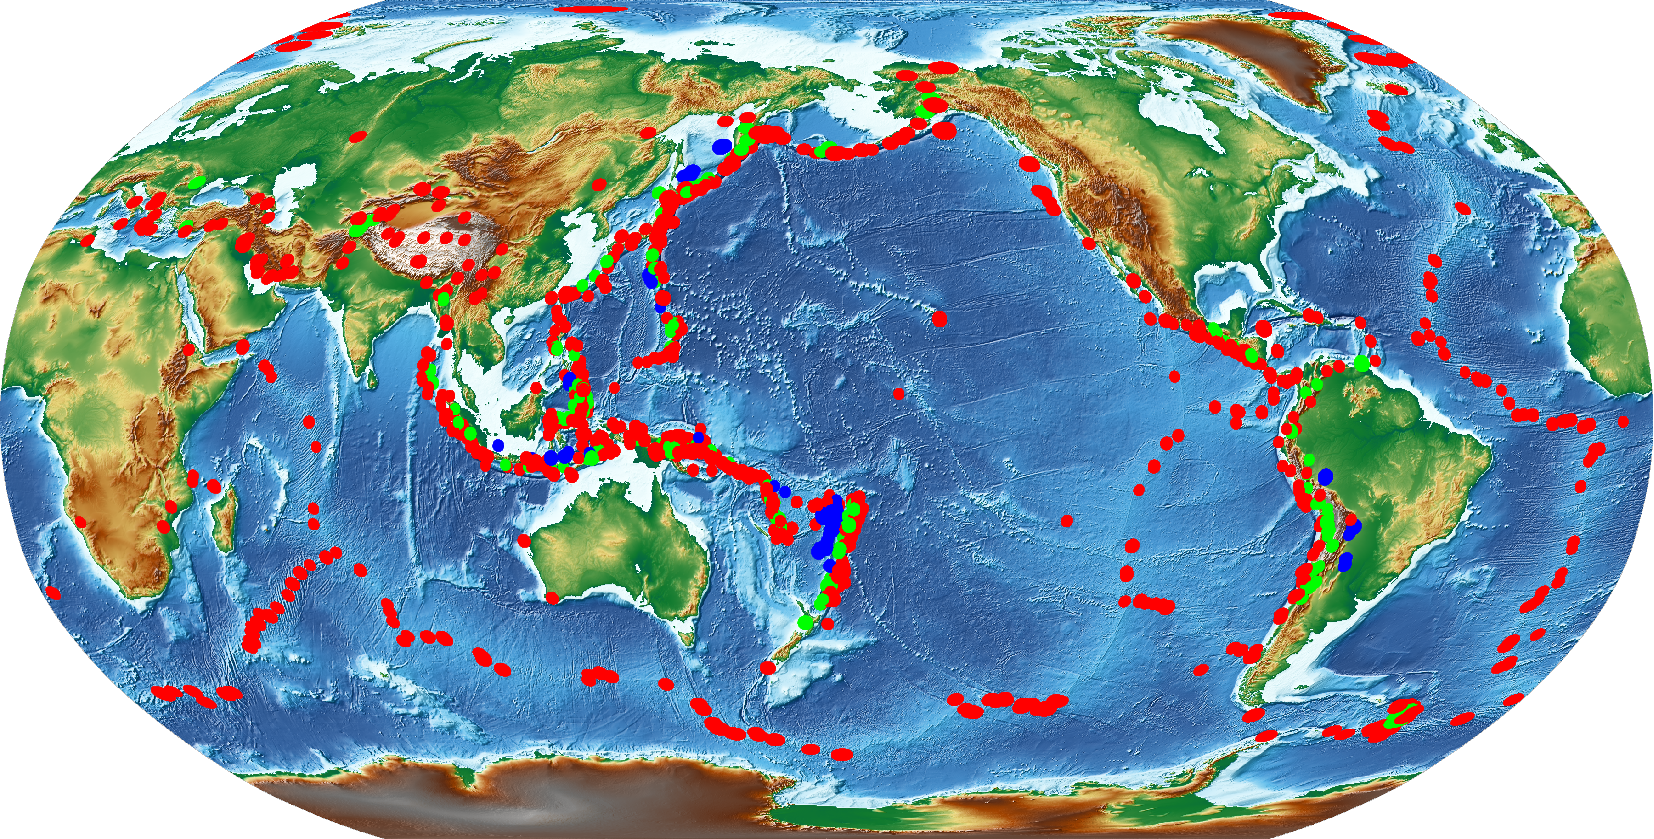
In this step I plot a map of the earth with all the quakes from 2018.
gmtbeginEarthpng
# Set parameters and positiongmtbasemap-Rg-JN14c-B+n
# Plot relief gridgmtgrdimage@earth_relief_06m-I
# Create cpt for the earthquakesgmtmakecpt-Cred,green,blue-T0,70,300,10000
# Plot quakesgmtplot@quakes_2018.txt-SE--C
gmtend
Technical Information
I use makecpt to create a CPT to color the earthquakes.
I used the earthquakes from the file quakes_2018.txt which has 5 columns.
Longitude
Latitude
Depth
Magnitude (x50)
Date
46.4223
-38.9126
10
260
2018-01-02T02:16:18.11
169.3488
-18.8355
242.77
260
2018-01-02T08:10:00.06
…
Note that the input file has the columns sorted as will be required by the plot and events modules. It was also used for animation 08.
Check it to see how it was downloaded and processed.
In the previous figure, I use the plot module to draw the symbols. This results that the symbols appear on all frames.
However if I want to plot quakes as they unfold, I have to use the events instead.
Important
events requires a time column in the input data and will use it and the animation time to determine when symbols should be plotted.
The -T is a required argument and is used to set the current plot time.
Now, in this attempt I use events with -T${MOVIE_COL0} to plot the quakes as dates progresses
cat<< 'EOF' > main.shgmt begin # Set parameters and position gmt basemap -Rg -JN${MOVIE_WIDTH} -B+n -X0 -Y0 # Create background map gmt grdimage @earth_relief_06m -I # Create cpt for the earthquakes gmt makecpt -Cred,green,blue -T0,70,300,10000 gmt events @quakes_2018.txt -SE- -C -T${MOVIE_COL0}gmt endEOF
gmtmoviemain.sh-NQuakes-Mf,png-Zs-V-C24cx12cx80-T2018-01-01T/2018-12-31T/1d-Gblack\
-Lc0--FONT_TAG=18p,Helvetica,white--FORMAT_CLOCK_MAP=-
Warning
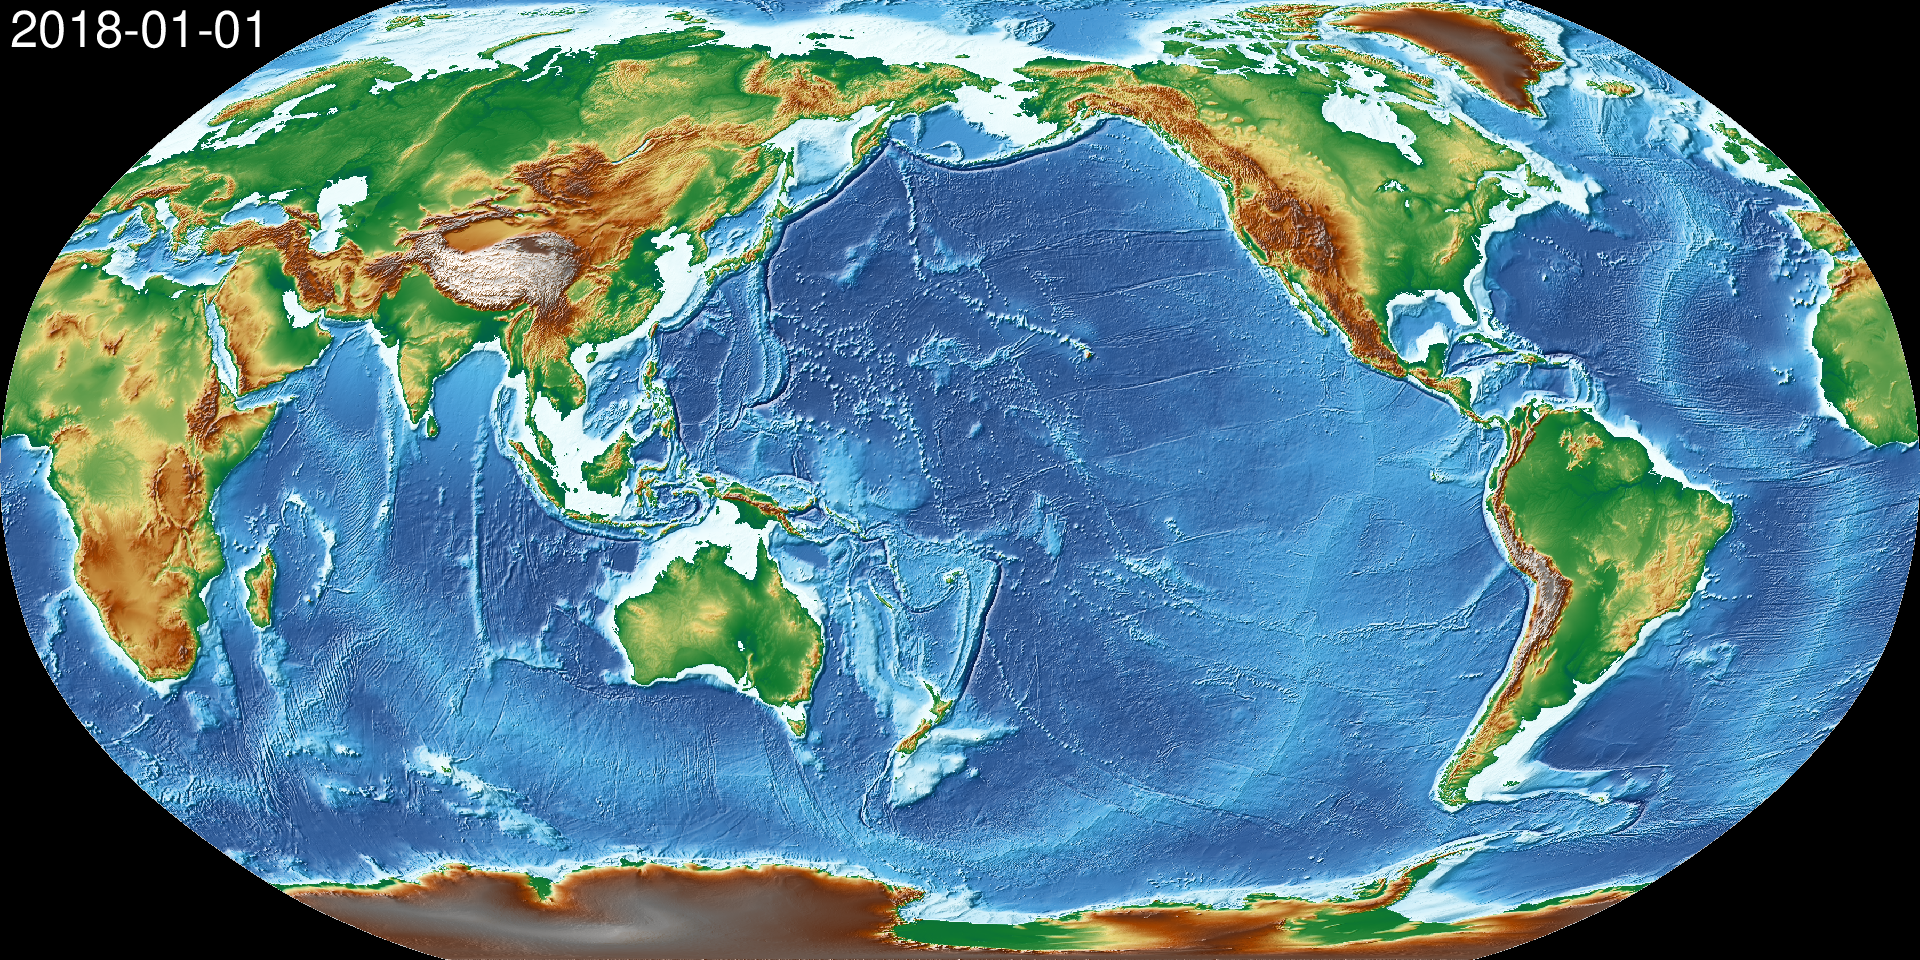
The map shows NO earthquakes. This is expected because there are no quakes (in the data file) before January first.
However, this could also be due to an error in the command.
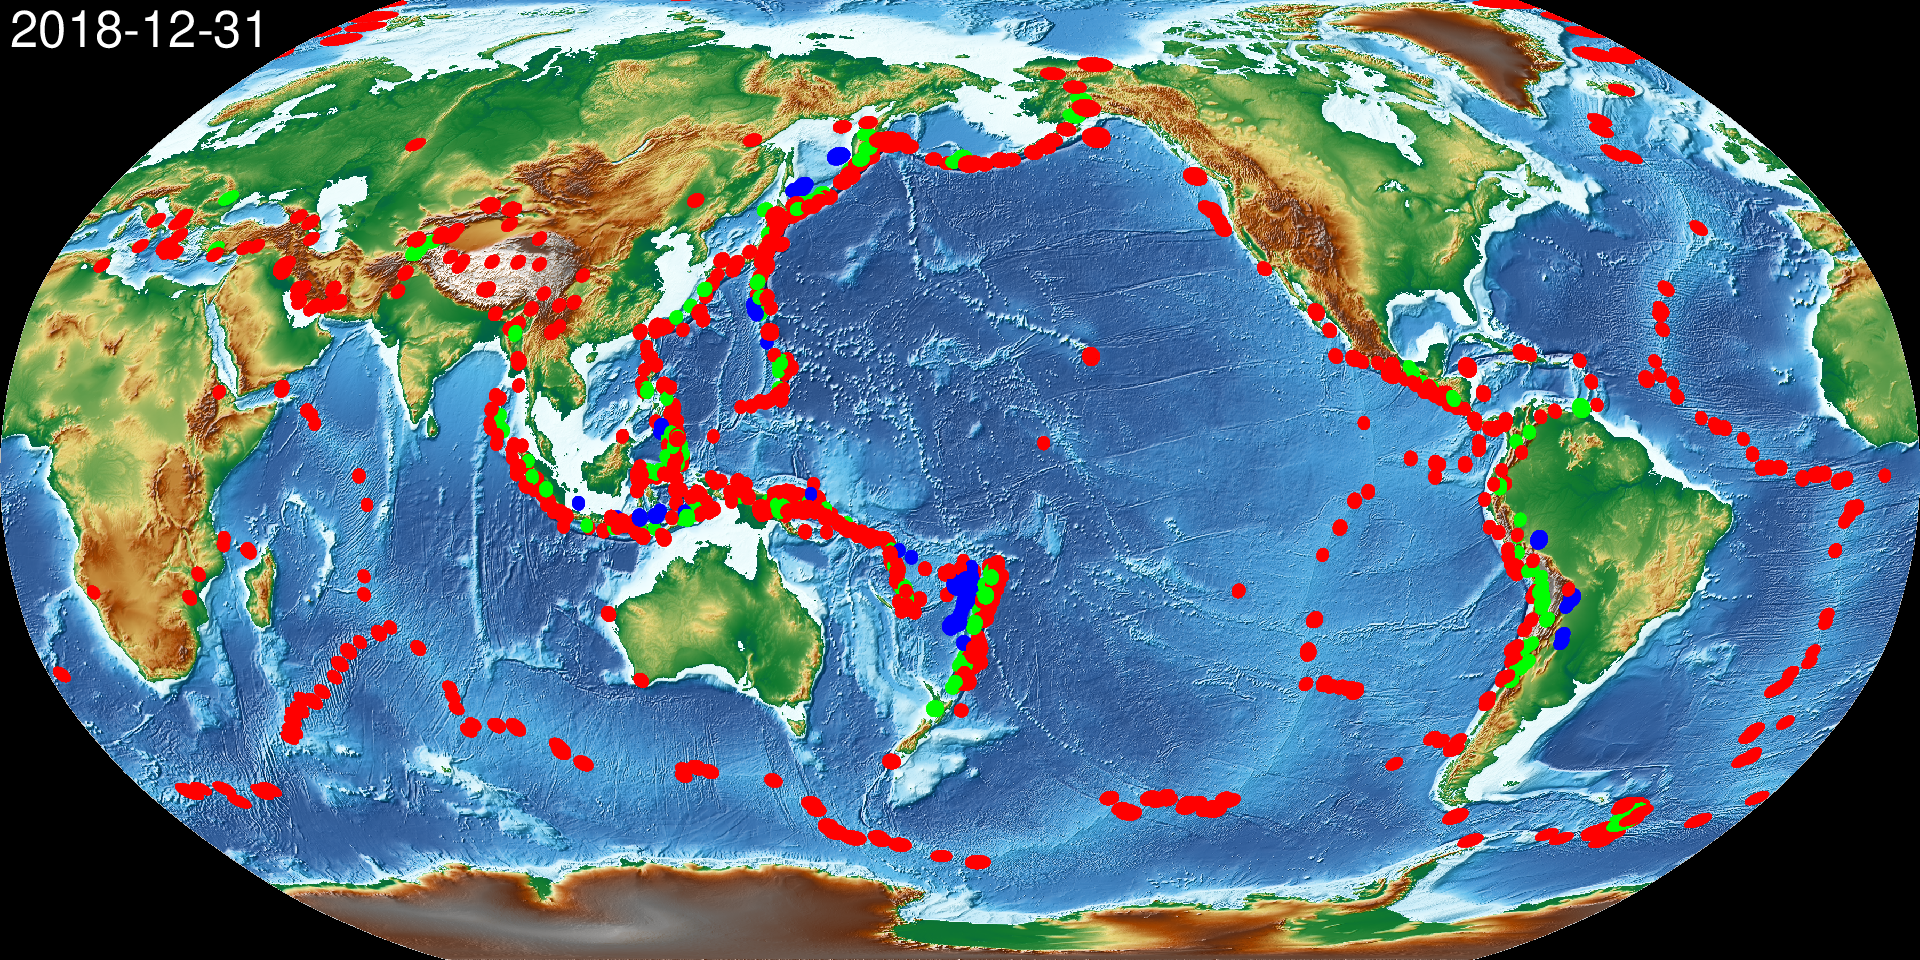
I must plot the frame from another date to see if the quakes appear.
In this step, we can make a draft animation. For this example, I recommend making a low quality (with 30 DPC) video to see if the quakes appear correctly.
In this step, instead of creating just the main script as before, I now create both a background script and a main script.
The background script (pre.sh) is used to:
create a CPT file that will be used to color the quakes.
make a static worldwide background map.
Important
The animation created is identical to the previous one.
The use of a background script allows the creation of the animation much faster because the CPT and the static background map will be created only once (instead of 365 times).
cat<< 'EOF' > pre.shgmt begin # Set parameters and position gmt basemap -Rg -JN${MOVIE_WIDTH} -X0 -Y0 -B+n # Create background map gmt grdimage @earth_relief_06m -I # Create cpt for the earthquakes gmt makecpt -Cred,green,blue -T0,70,300,10000 -H > quakes.cptgmt endEOF
cat<< 'EOF' > main.shgmt begin gmt basemap -Rg -JN${MOVIE_WIDTH} -X0 -Y0 -B+n gmt events @quakes_2018.txt -SE- -Cquakes.cpt -T${MOVIE_COL0}gmt endEOF
gmtmoviemain.sh-Sbpre.sh-NQuakes-Ml,png-Zs-V-C24cx12x80-T2018-01-01T/2018-12-31T/1d-Gblack\
-Lc0--FONT_TAG=18p,Helvetica,white--FORMAT_CLOCK_MAP=-
Technical Information
For the CPT, I must use -H and give it a name, and then use that name in main.sh.
I add -Sbpre.sh within the movie module to use the background script.
I repeat the basemap command in the main and background scripts so both have the same positioning (i.e., -X and -Y) and parameters (i.e. -R and -J).
In the previous animation, the earthquakes appear but it is hard to see when they do it.
With events it is possible to draw attention to the arrival of a new event.
In this step I announce each quake by magnifying size and whitening the color for a little bit (during the rise phase).
Later the symbols return to their original properties during the decay phase.
The plateau phase is not used.
Wessel, P., Luis, J. F., Uieda, L., Scharroo, R., Wobbe, F., Smith, W. H. F., & Tian, D. (2019). The Generic Mapping Tools Version 6. Geochemistry, Geophysics, Geosystems, 20(11), 5556–5564. https://doi.org/10.1029/2019GC008515
Wessel, P., Esteban, F., & Delaviel-Anger, G. (2024). The Generic Mapping Tools and animations for the masses. Geochemistry, Geophysics, Geosystems, 25, e2024GC011545. https://doi.org/10.1029/2024GC011545.