Prior to GMT 6.0, ambitious movie makers had to write complicated scripts where the advancement of frames was explicitly done by a shell loop.
At the end of the script, you would have to convert your PostScript plot to a raster image with a name that is lexically increasing,
and then later you would use some external software to assemble the movie. Hence, only very brave GMT users attempted to make GMT animations.
Here you can see a more complete explanation
and some examples of those times.
GMT 6 (Wessel et al. 2019) simplified all that by adding movie-making modules
that were later refined with GMT 6.5 (Wessel et al. 2024).
These modules empower users to create animations by taking over non-trivial tasks.
Bash scripting environment: The examples in this tutorial are written in Bash and may not work correctly in other shell environments (e.g., zsh, fish, or Windows cmd).
Here I explain how to make an animation of a moving object which only requires the movie module.
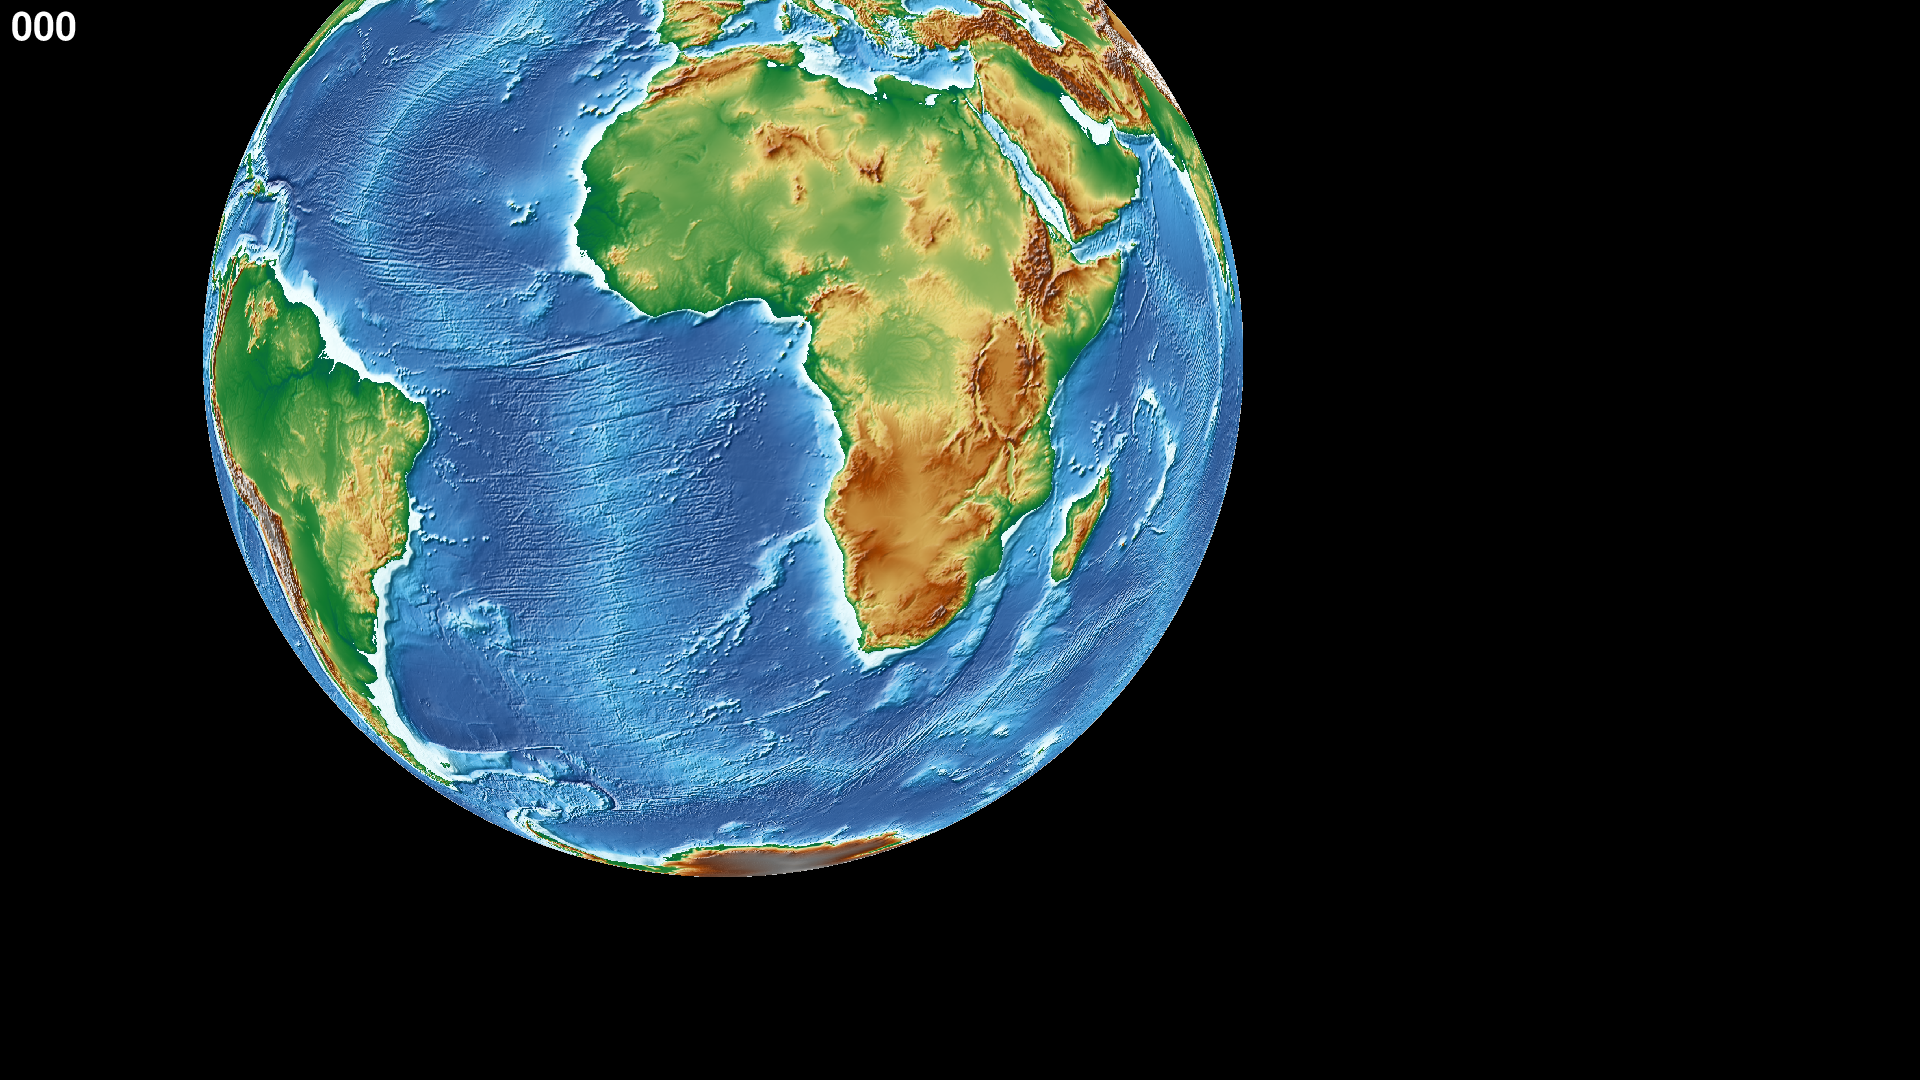
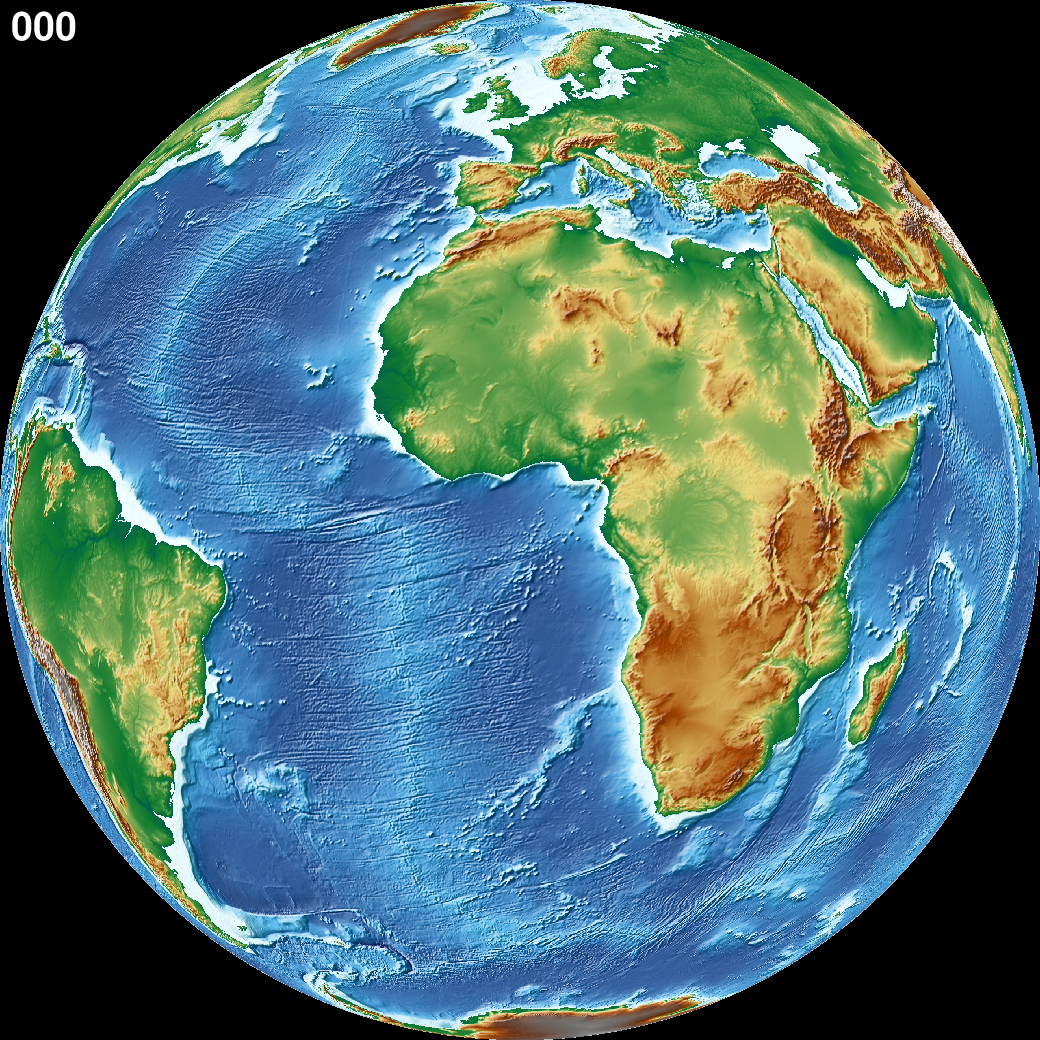
As an example, I will create an animation of the Earth spinning like the one below.
Technical Information
This animation was created using 360 images (or frames), with each frame representing a 1-degree rotation in the central longitude of the map,
displayed at 24 fps.
To create the animation, I follow these four steps:
The movie parameters are key to making animations.
They are automatically assigned by different movie arguments (see tables below).
There are two sets of parameters:
Variable parameters:
These values change with the frame number.
They must be used in the main script to introduce variations in the frames.
Parameter
Purpose or contents
Set by Movie
MOVIE_FRAME
Number of current frame being processed
-T
MOVIE_TAG
Formatted frame number (string)
-T
MOVIE_NAME
Prefix for current frame image
-N and -T
MOVIE_COLk
Variable k from data column k, current row
-Ttimefile
MOVIE_TEXT
The full trailing text for current row
-Ttimefile
MOVIE_WORDw
Word w from trailing text, current row
-Ttimefile
Constant parameters:
These values do NOT change during the whole movie.
They can be used in the main script (and in the optional background and foreground scripts).
Parameter
Purpose or contents
Set by Movie
MOVIE_NFRAMES
Total number of frames in the movie
-T
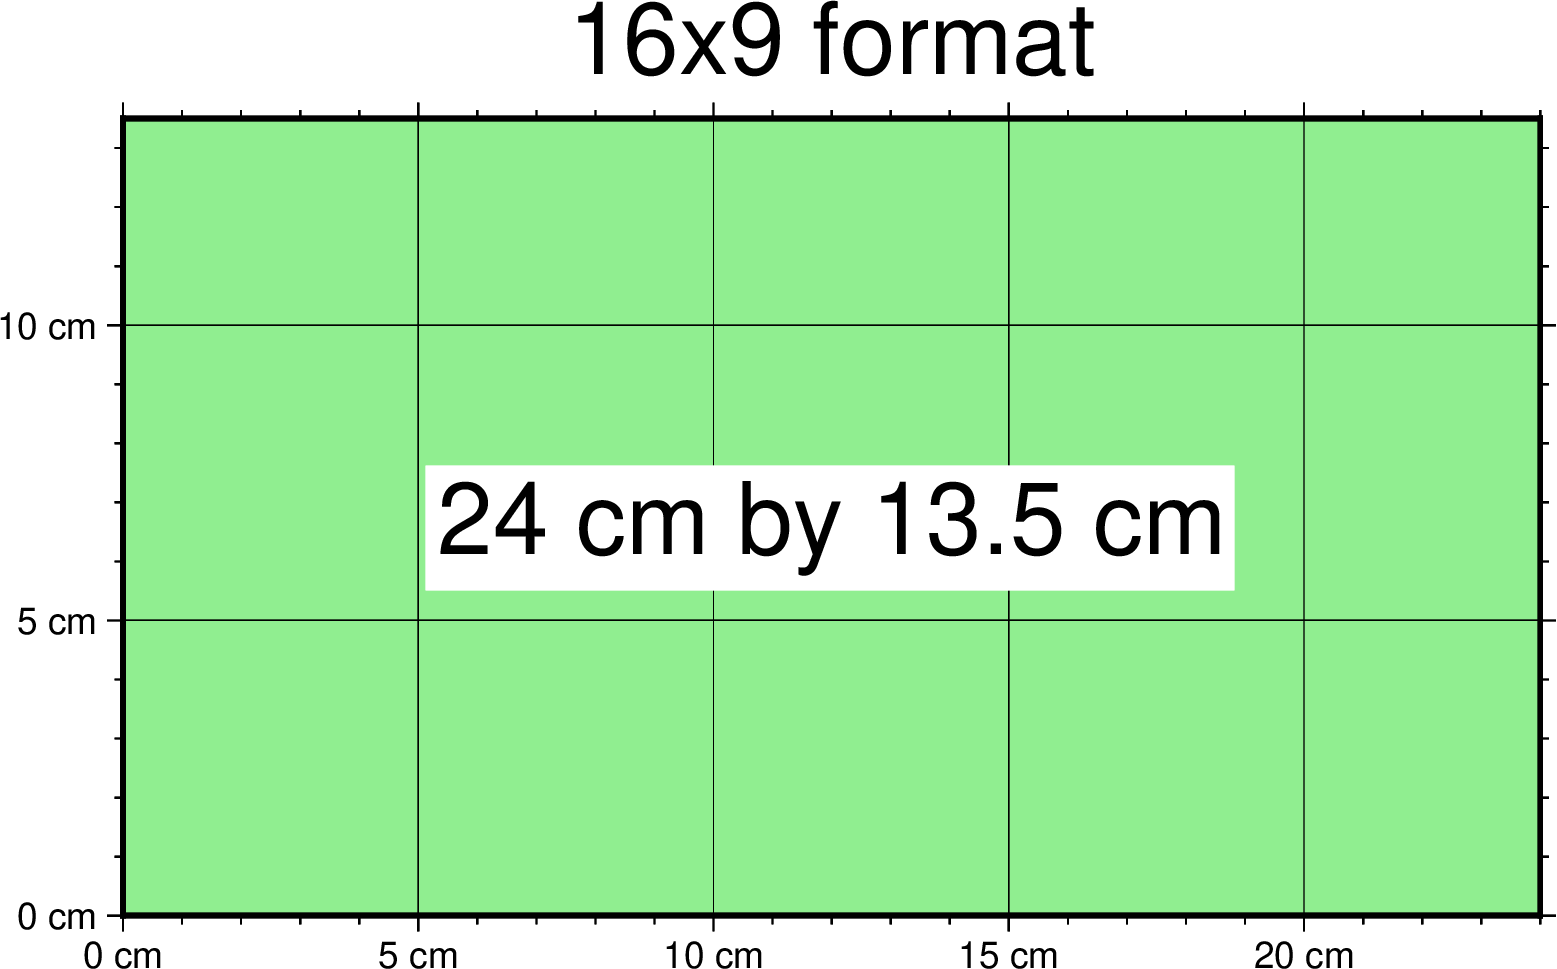
MOVIE_WIDTH
Width of the movie canvas
-C
MOVIE_HEIGHT
Height of the movie canvas
-C
MOVIE_DPU
Dots (pixels) per unit used to convert to image
-C
MOVIE_RATE
Number of frames displayed per second
-D
Important
In order to introduce changes in the frames we must use the variable parameters.
The number of frames (-T) is another important aspect to make animations.
There are 3 ways to do it:
-TNumber:
If you supply a single (integer) value, then it will be the total number of frames.
Under the hood, this will create a one-column data set from 0 to that number minus one.
For example, for -T10 I get values from 0 to 9.
In the main script, you have to use the MOVIE_FRAME parameter to access the values.
-Tmin/max/inc:
If you supply 3 values, then GMT will create a one-column data set from min to max, incrementing by inc.
You have to use the MOVIE_COL0 parameter to access the values of the one-column data set.
The total of number of frames will be:
If you supply the name of a file, then GMT will access it and use one record (i.e. row) per frame.
This method allows you to have more than one-column and can be used to make more complex animations.
For example, you can have a second column with numbers that you can access using MOVIE_COL1.
The file can even have trailing text that will be accessed with MOVIE_TEXT.
Now I update the script with movie parameters.
First, I use the MOVIE_FRAME variable parameter to set the central longitude of the map.
I also use the MOVIE_WIDTH constant parameter (in main.sh) to set the width of the map (instead of 13c).
Be careful. This step can be quite time (and resource) consuming.
By default, movie uses all the cores available to speed up the frame creation process.
So probably you can’t do anything else while GMT is creating all the frames (maybe you can take a break, or have lunch).
Also you could use -x to specify the number of active cores to be used.
Here I explain how to make an animation with appearing objects.
This is more complex and requires the use events and movie modules.
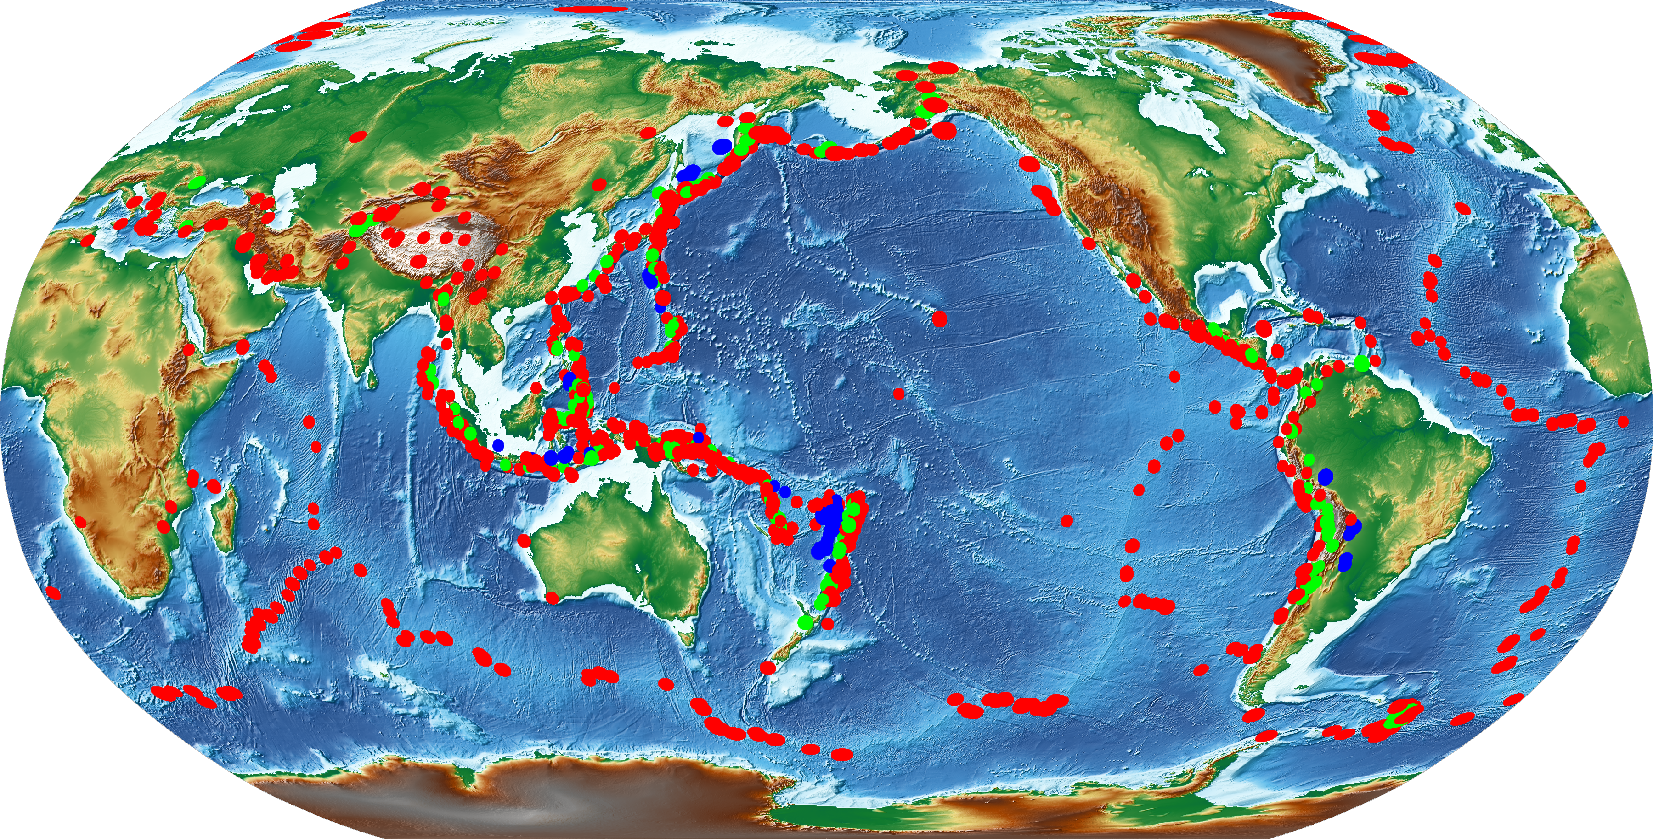
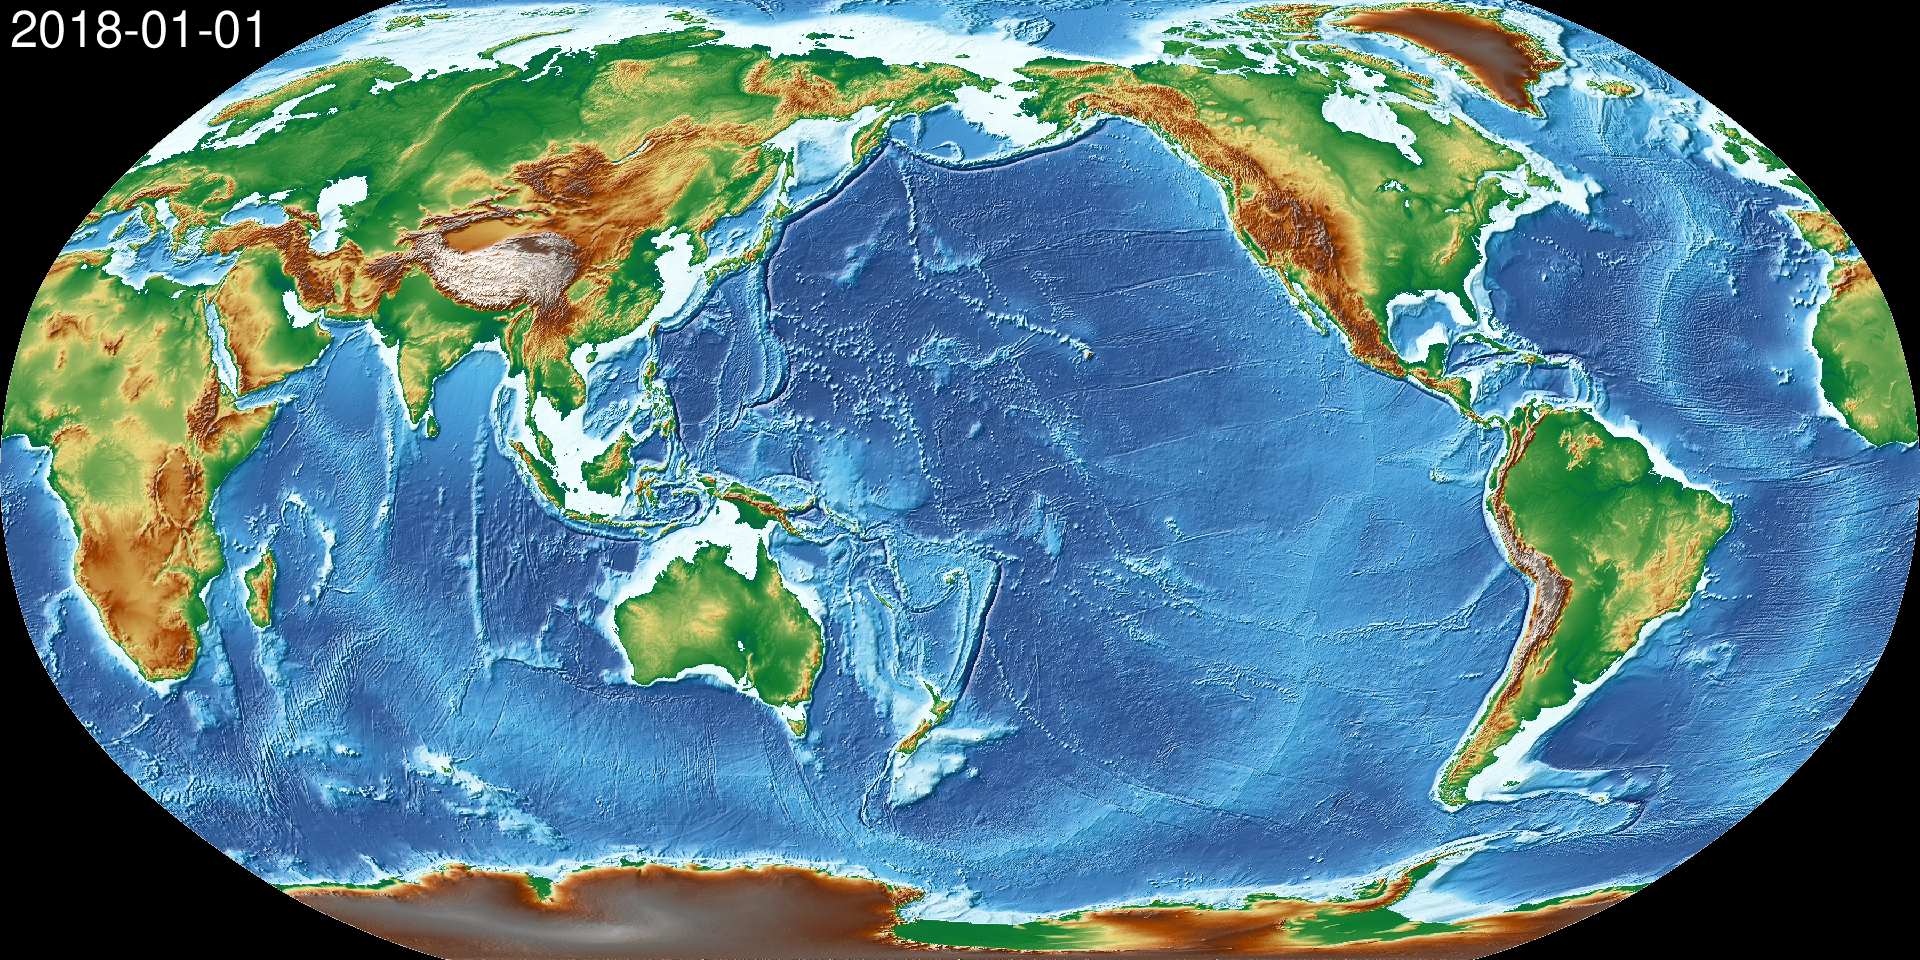
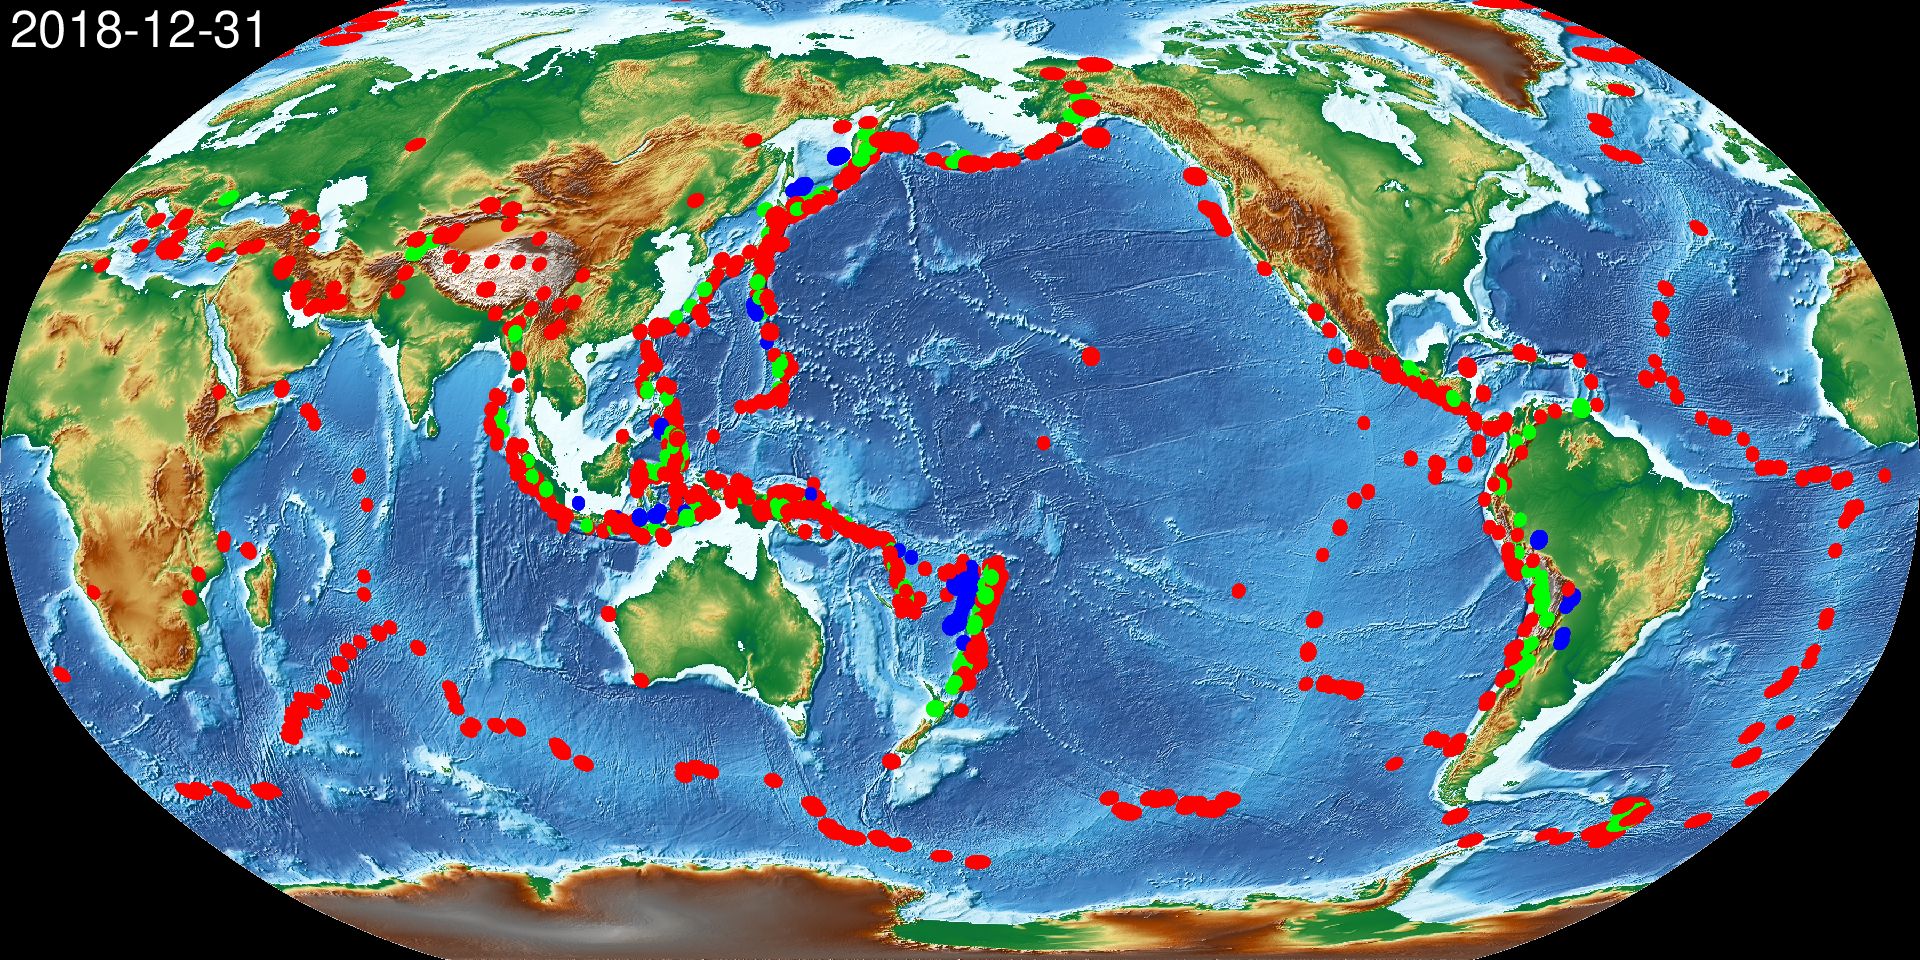
In this example, I create an animation showing the occurrences of earthquakes during the year 2018 (with one frame per day).
Note that the earthquakes are drawn as they occur and remain visible until the end of the animation.
In this step I plot a map of the earth with all the quakes from 2018.
gmtbeginEarthpng
# Set parameters and positiongmtbasemap-Rg-JN14c-B+n
# Plot relief gridgmtgrdimage@earth_relief_06m-I
# Create cpt for the earthquakesgmtmakecpt-Cred,green,blue-T0,70,300,10000
# Plot quakesgmtplot@quakes_2018.txt-SE--C
gmtend
Technical Information
I use makecpt to create a CPT to color the earthquakes.
I used the earthquakes from the file quakes_2018.txt which has 5 columns.
Longitude
Latitude
Depth
Magnitude (x50)
Date
46.4223
-38.9126
10
260
2018-01-02T02:16:18.11
169.3488
-18.8355
242.77
260
2018-01-02T08:10:00.06
…
Note that the input file has the columns sorted as will be required by the plot and events modules. It was also used for animation 08.
Check it to see how it was downloaded and processed.
In the previous figure, I use the plot module to draw the symbols. This results that the symbols appear on all frames.
However if I want to plot quakes as they unfold, I have to use the events instead.
Important
events requires a time column in the input data and will use it and the animation time to determine when symbols should be plotted.
The -T is a required argument and is used to set the current plot time.
Now, in this attempt I use events with -T${MOVIE_COL0} to plot the quakes as dates progresses
cat<< 'EOF' > main.shgmt begin # Set parameters and position gmt basemap -Rg -JN${MOVIE_WIDTH} -B+n -X0 -Y0 # Create background map gmt grdimage @earth_relief_06m -I # Create cpt for the earthquakes gmt makecpt -Cred,green,blue -T0,70,300,10000 gmt events @quakes_2018.txt -SE- -C -T${MOVIE_COL0}gmt endEOF
gmtmoviemain.sh-NQuakes-Mf,png-Zs-V-C24cx12cx80-T2018-01-01T/2018-12-31T/1d-Gblack\
-Lc0--FONT_TAG=18p,Helvetica,white--FORMAT_CLOCK_MAP=-
Warning
The map shows NO earthquakes. This is expected because there are no quakes (in the data file) before January first.
However, this could also be due to an error in the command.
I must plot the frame from another date to see if the quakes appear.
In this step, we can make a draft animation. For this example, I recommend making a low quality (with 30 DPC) video to see if the quakes appear correctly.
In this step, instead of creating just the main script as before, I now create both a background script and a main script.
The background script (pre.sh) is used to:
create a CPT file that will be used to color the quakes.
make a static worldwide background map.
Important
The animation created is identical to the previous one.
The use of a background script allows the creation of the animation much faster because the CPT and the static background map will be created only once (instead of 365 times).
cat<< 'EOF' > pre.shgmt begin # Set parameters and position gmt basemap -Rg -JN${MOVIE_WIDTH} -X0 -Y0 -B+n # Create background map gmt grdimage @earth_relief_06m -I # Create cpt for the earthquakes gmt makecpt -Cred,green,blue -T0,70,300,10000 -H > quakes.cptgmt endEOF
cat<< 'EOF' > main.shgmt begin gmt basemap -Rg -JN${MOVIE_WIDTH} -X0 -Y0 -B+n gmt events @quakes_2018.txt -SE- -Cquakes.cpt -T${MOVIE_COL0}gmt endEOF
gmtmoviemain.sh-Sbpre.sh-NQuakes-Ml,png-Zs-V-C24cx12x80-T2018-01-01T/2018-12-31T/1d-Gblack\
-Lc0--FONT_TAG=18p,Helvetica,white--FORMAT_CLOCK_MAP=-
Technical Information
For the CPT, I must use -H and give it a name, and then use that name in main.sh.
I add -Sbpre.sh within the movie module to use the background script.
I repeat the basemap command in the main and background scripts so both have the same positioning (i.e., -X and -Y) and parameters (i.e. -R and -J).
In the previous animation, the earthquakes appear but it is hard to see when they do it.
With events it is possible to draw attention to the arrival of a new event.
In this step I announce each quake by magnifying size and whitening the color for a little bit (during the rise phase).
Later the symbols return to their original properties during the decay phase.
The plateau phase is not used.
Wessel, P., Luis, J. F., Uieda, L., Scharroo, R., Wobbe, F., Smith, W. H. F., & Tian, D. (2019). The Generic Mapping Tools Version 6. Geochemistry, Geophysics, Geosystems, 20(11), 5556–5564. https://doi.org/10.1029/2019GC008515
Wessel, P., Esteban, F., & Delaviel-Anger, G. (2024). The Generic Mapping Tools and animations for the masses. Geochemistry, Geophysics, Geosystems, 25, e2024GC011545. https://doi.org/10.1029/2024GC011545.