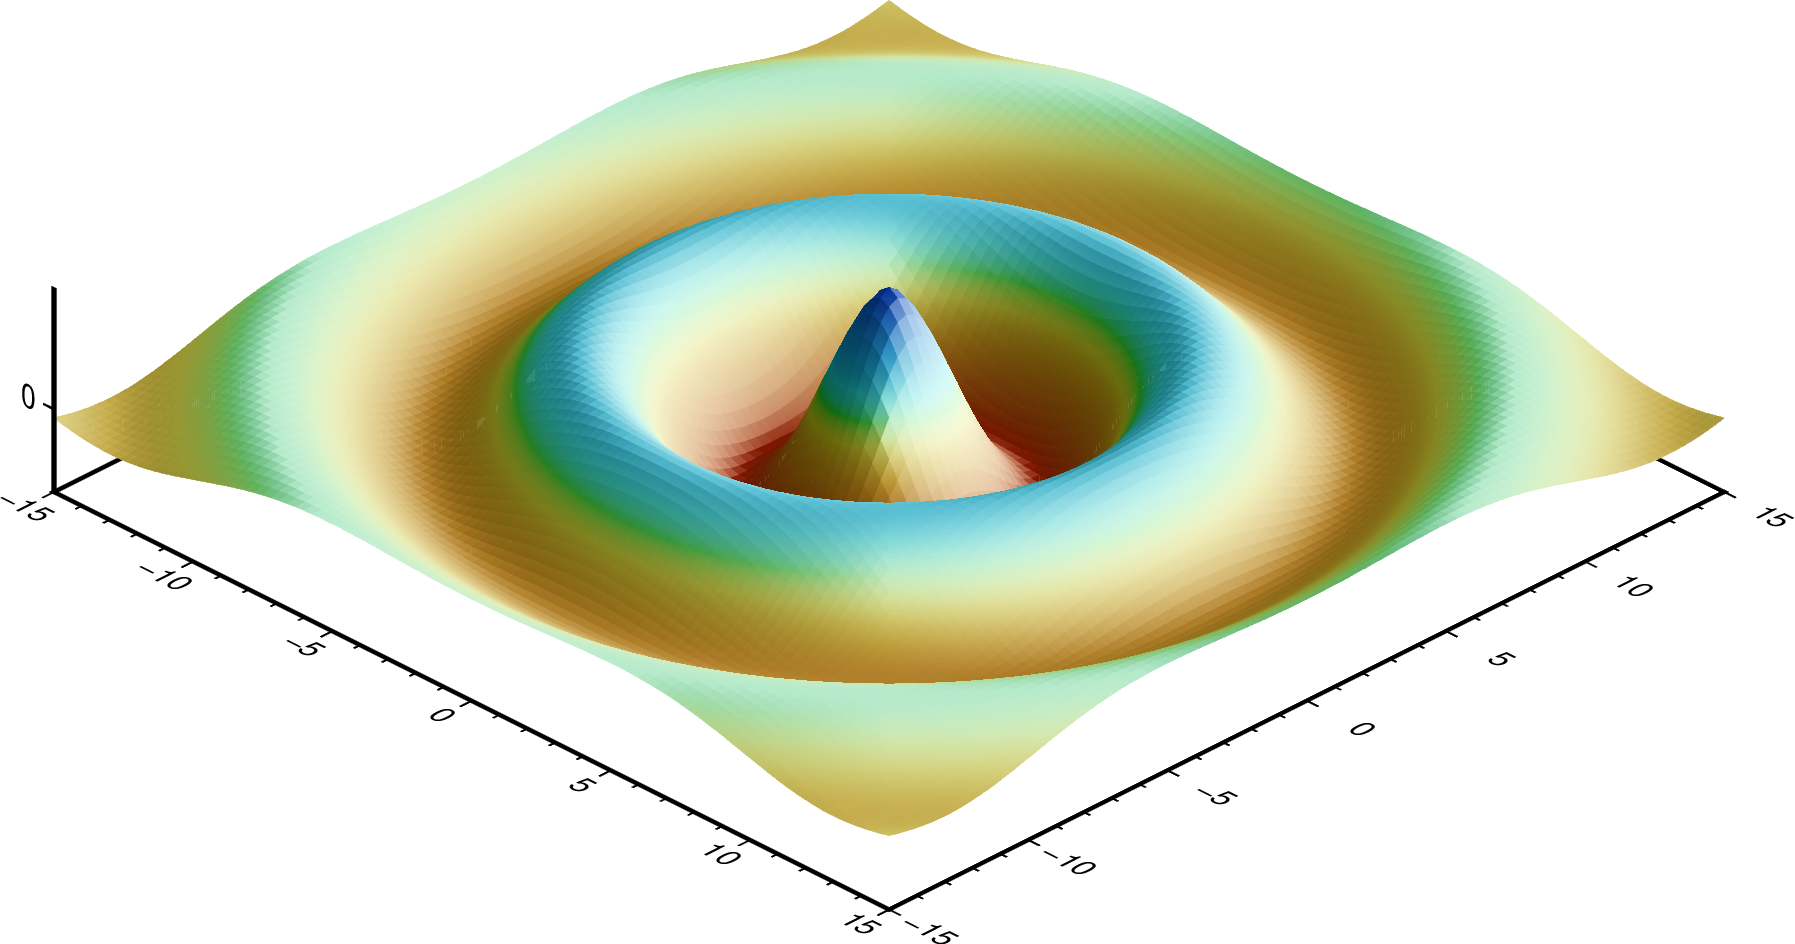
Plotting a surface
grdview can plot 3-D surfaces using the -Q
parameter with the s directive. Here, we use grdmath to create
a netCDF file containing a grid for plotting.
Note that the -p parameter here controls the azimuth and elevation angle of the view.
We use the -B parameter twice - the first specifies
the \(x\)- and \(y\)-axes frame attributes and the second specifies the
\(z\)-axis frame attributes using the z directive.
The -I parameter specifies the illumination; here we
use an azimuth of 45° using the +a modifier.
gmt grdmath -R-15/15/-15/15 -I0.3 X Y HYPOT DUP 2 MUL PI MUL 8 DIV COS EXCH NEG 10 DIV EXP MUL 0.001 SUB = example_grid.nc
gmt begin grdview_surface png
   gmt grdview example_grid.nc -Ba5f1 -Bza5f1 -JX10C -JZ2c -Qs -Croma -p135/30 -I+a45
gmt end show