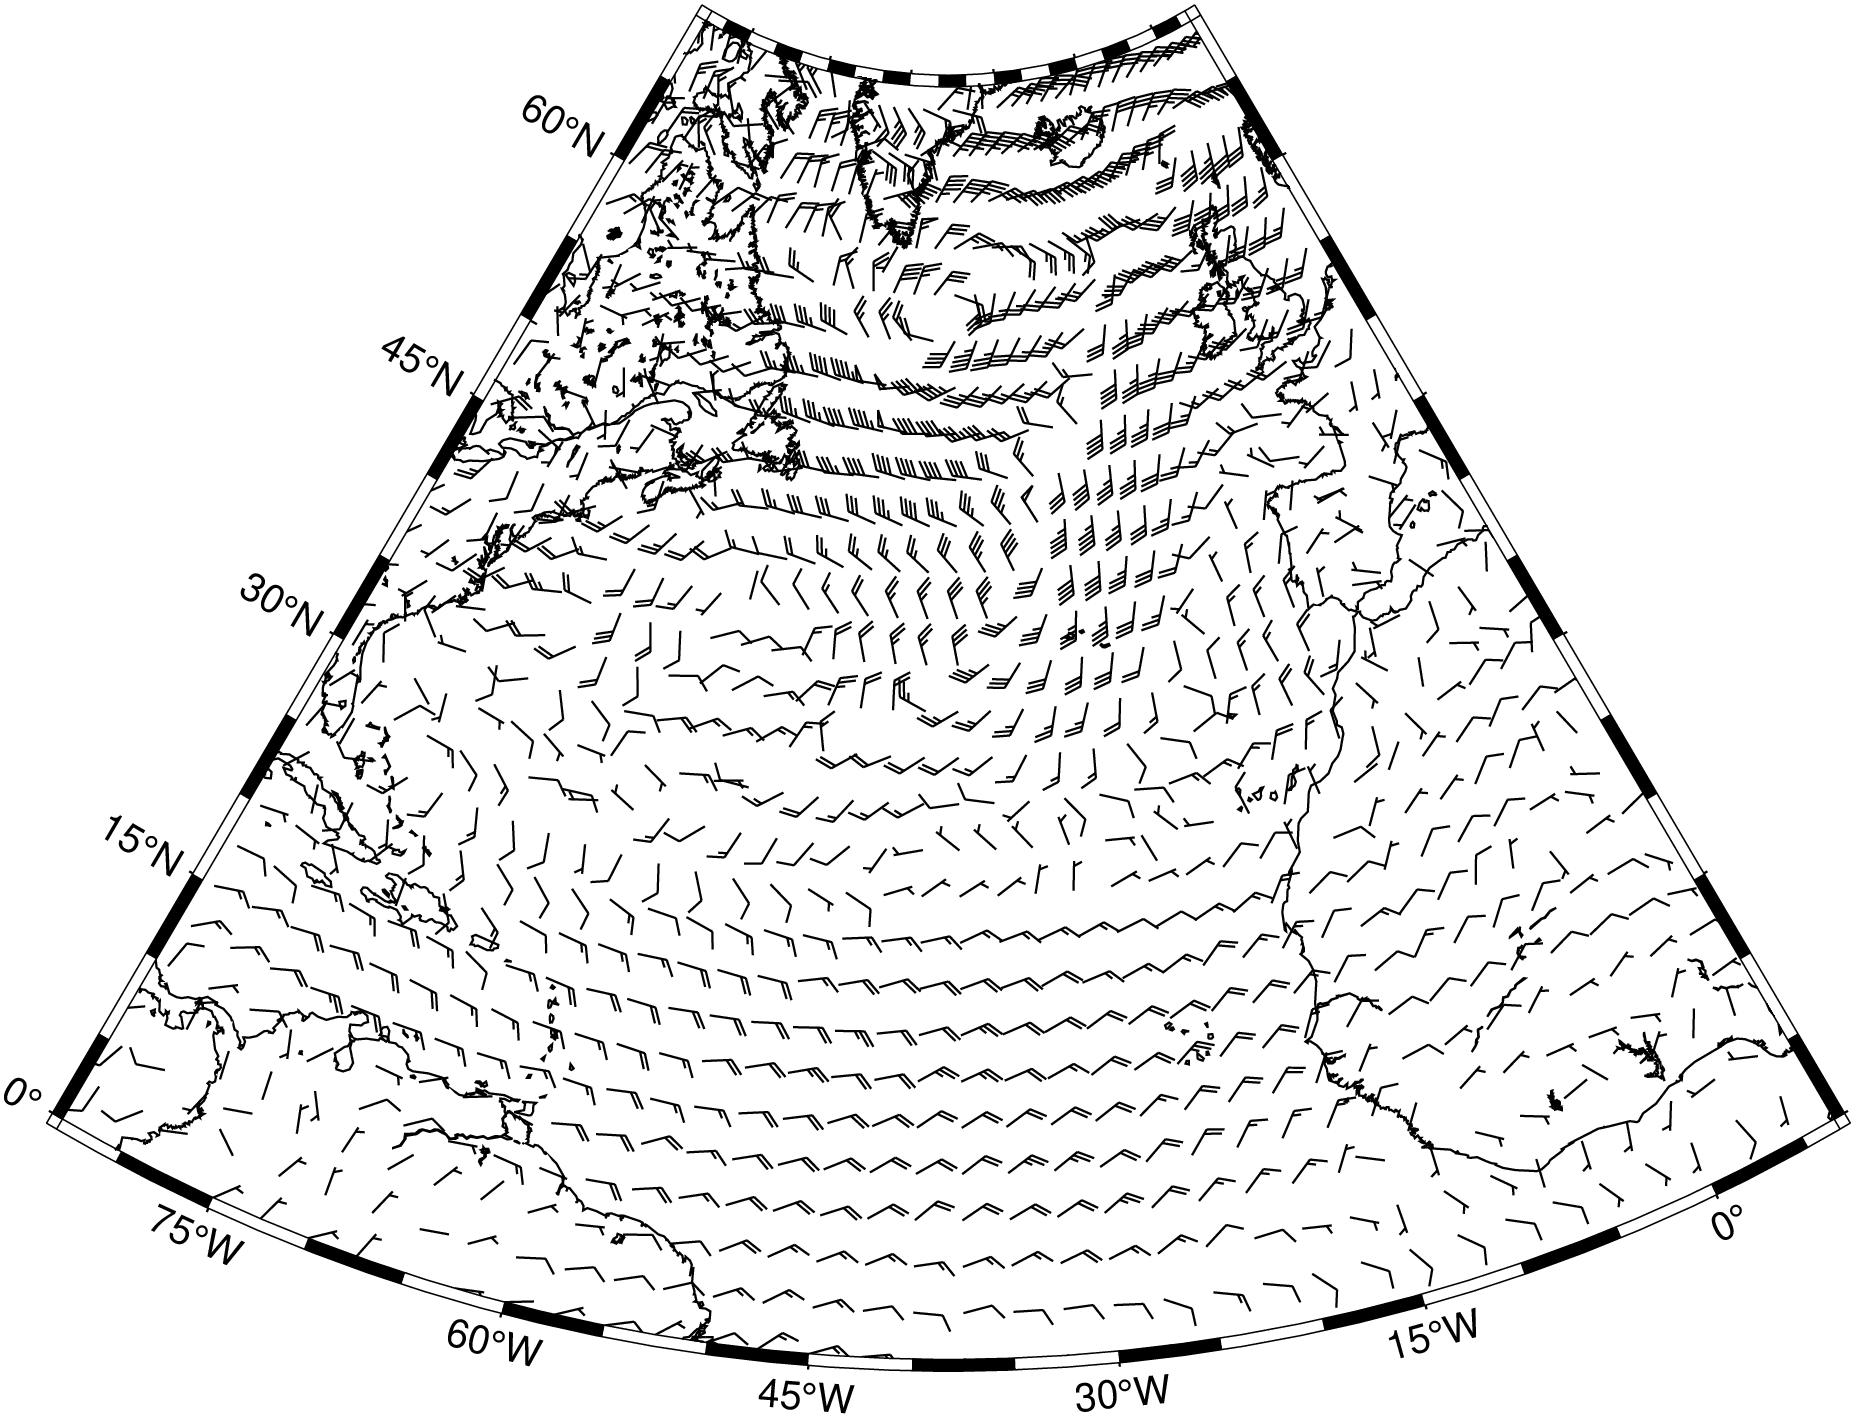
Plot wind barb field from two component grids with the x and y components of the wind field.
or
julia windbarbs(arg1; kwargs...)
Plot wind barb field from a data table with the x and y components of the wind field.
Description
Read two 2-D grid files which represents the x- and y-components of a wind field and produces a wind field plot by drawing wind barbs with orientation and barbs according to the information in the files. Alternatively, polar coordinate r, theta grids may be given instead. Alternatively, a data table with the x and y components of the wind field may be given.
Required Arguments
compx Contains the x-components of the wind field.
compy Contains the y-components of the wind field.
Optional Arguments
A or polar : – polar=true
The grid files contain polar (r, theta) components instead of Cartesian (x, y) [Default is Cartesian components]. This option is valid only when the input files are 2-D grids.
B or axes or frame
Set map boundary frame and axes attributes. Default is to draw and annotate left, bottom and vertical axes and just draw left and top axes. More at frame
C or color or cmap or colorap or colorscale : – color=cpt
Where cpt is a GMTcpt type or a cpt file name (for grd_z only). Alternatively, supply the name of a GMT color master dynamic CPT [turbo] to automatically determine a continuous CPT from the grid’s z-range; you may round up/down the z-range by adding +izinc. Yet another option is to specify color=“color1,color2 [,color3 ,…]” or color=((r1,g1,b1),(r2,g2,b2),…) to build a linear continuous CPT from those colors automatically. In this case color1 etc can be a (r,g,b) triplet, a color name, or an HTML hexadecimal color (e.g. #aabbcc ) (see Setting color). When not explicitly set, but a color map is needed, we will either use the current color map, if available (set by a previous call to makecpt), or the default turbo color map.
G or fill : – fill=fill
Sets color or shade for wind barb interiors (see Fill color/pattern) [Default is no fill].
I or inc or increment or spacing : – inc=x_inc|inc=(x_inc, y_inc)|inc=“x”“multx”[“/multy”]
Only plot wind barbs at nodes every x_inc, y_inc apart (must be multiples of original grid spacing). Append m for arc minutes or s for arc seconds. Alternatively, use inc=“x” to specify the multiples multx[/multy] directly [Default plots every node]. Example inc=“x10/5” to select every other 10 nodes in x and 5 nodes in y. NOTE: by default we estimate good values so that the arrows do no overlap so you may start by jumping this option unless some fine control is desired.
J or proj or projection : – proj=
Select map projection. More at proj
N or noclip or no_clip : noclip=true
Do NOT clip wind barbs at map boundaries [Default will clip].
Q or barbs : – barbs=(length=length, angle=angle, fill=fill, pen=pen, justify=“b|e|c”, speed=speed, width=width)
Modify wind barb parameters. Append wind barb length [Default is 0.5c]. Several modifiers may be appended to specify the placement of barbs, their shapes, and the justification of the wind barb. Below, left and right refers to the side of the wind barb line when viewed from the start point to the end point of the segment. Chose among these modifiers:
angle - Set the angle of the wind barb [120].
fill - Turn off fill (if -) or set the wind barb fill [Default fill is used, which may be no fill].
pen - Sets the wind barb pen attributes. If pen has a leading - then the outline is not drawn [Default pen is used, and outline is drawn].
justify - Determines how the input x, y point relates to the wind barb. Choose from beginning [default], end, or center.
speed - Set the wind speed which corresponds to a long barb [default 5].
width - Set the width of wind barbs.
R or region or limits : – limits=(xmin, xmax, ymin, ymax)|limits=(BB=(xmin, xmax, ymin, ymax),)|limits=(LLUR=(xmin, xmax, ymin, ymax),units=“unit”)| …more
Specify the region of interest. More at limits. For perspective view view, optionally add zmin,zmax. This option may be used to indicate the range used for the 3-D axes. You may ask for a larger w/e/s/n region to have more room between the image and the axes.
T or sign_scale : – sign_scale=true
Means the azimuths of Cartesian data sets should be adjusted according to the signs of the scales in the x- and y-directions [Leave alone]. This option can be used to convert vector azimuths in cases when a negative scale is used in one of both directions (e.g., positive down).
U or time_stamp : – time_stamp=true|time_stamp=(just=“code”, pos=(dx,dy), label=“label”, com=true)
Draw GMT time stamp logo on plot. More at timestamp
V or verbose : – verbose=true|verbose=level
Select verbosity level. More at verbose
W or pen=pen
Set pen attributes for the arrow stem [Defaults: width = default, color = black, style = solid]. See Pen attributes and Vector attributes for arrow line terminations.
X or xshift or x_offset : xshift=true|xshift=x-shift|xshift=(shift=x-shift, mov=“a|c|f|r”)
Shift plot origin. More at xshift
Y or yshift or y_offset : yshift=true|yshift=y-shift|yshift=(shift=y-shift, mov=“a|c|f|r”)
Shift plot origin. More at yshift
Z or azimuth : – azimuth=true
The theta grid provided contains azimuths rather than directions (implies polar=true). This option is valid only when the input files are 2-D grids.
f or colinfo : – colinfo=??
Specify the data types of input and/or output columns (time or geographical data). More at
p or view or perspective : – view=(azim, elev)
Default is viewpoint from an azimuth of 200 and elevation of 30 degrees.
Specify the viewpoint in terms of azimuth and elevation. The azimuth is the horizontal rotation about the z-axis as measured in degrees from the positive y-axis. That is, from North. This option is not yet fully expanded. Current alternatives are:
view=??
A full GMT compact string with the full set of options.
view=(azim,elev)
A two elements tuple with azimuth and elevation
view=true
To propagate the viewpoint used in a previous module (makes sense only in bar3!) More at perspective
t or transparency or alpha: – alpha=50
Set PDF transparency level for an overlay, in (0-100] percent range. [Default is 0, i.e., opaque]. Works only for the PDF and PNG formats.
Examples
To draw the wind field given by the files r.nc and theta.nc on a barb plot with 0.25 cm length and centered on the node locations, run: