(20) Custom plot symbols
One is often required to make special maps that shows the distribution of certain features but one would prefer to use a custom symbol instead of the built-in circles, squares, triangles, etc. in the GMT plotting programs plot and plot3d. Here we demonstrate one approach that allows for a fair bit of flexibility in designing ones own symbols. The following recipe is used when designing a new symbol.
Use basemap (or engineering paper!) to set up an empty grid that goes from -0.5 to +0.5 in both x and y. Use ruler and compass to draw your new symbol using straight lines, arcs of circles, and stand-alone geometrical objects (see plot man page for a full description of symbol design). Here we will create two new symbols: a volcano and a bulls eye.
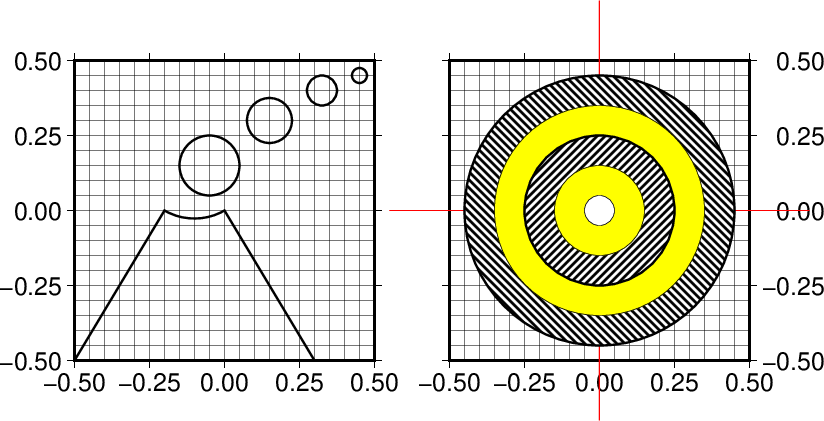
After designing the symbol we will encode it using a simple set of rules. In our case we describe our volcano and bulls eye using these three freeform polygon generators:
\(x_0\) \(y_0\) r C [ -Gfill ] [ -Wpen ] Draw \(x_0\) \(y_0\) M [ -Gfill ] [ -Wpen ] Start new element at \(x_0\), \(y_0\)
\(x_1\) \(y_1\) D Draw straight line from current point to \(x_1\), \(y_1\) around (\(x_0\), \(y_0\))
\(x_0\) \(y_0\) r \(\alpha_1\) \(\alpha_2\) A Draw arc segment of radius r from angle \(\alpha_1\) to \(\alpha_2\)
We also add a few stand-alone circles (for other symbols, see plot man page):
\(x_0\) \(y_0\) r C [ -Gfill ] [ -Wpen ] Draw \(x_0\) \(y_0\) r c [ -Gfill ] [ -Wpen ] Draw single circle of radius r around \(x_0\), \(y_0\)
The optional -G and -W can be used to hardwire the color fill and pen for segments (use - to disallow fill or line for any specific feature). By default the segments are painted based on the values of the command line settings.
Manually applying these rules to our volcano symbol results in a definition file
volcano.def:Without much further discussion we also make a definition file
bullseye.deffor a multi-colored bulls eye symbol. Note that the symbol can be created beyond the -0.5 to +0.5 range, as shown by the red lines. There is no limit in GMT to the size of the symbols. The center, however, will always be at (0,0). This is the point to which the coordinates in plot refers.The values refer to positions and dimensions illustrated in the Figure above.
Given proper definition files we may now use them with plot or plot3d.
We are now ready to give it a try. Based on the hotspot locations in the remote
file hotspots.txt (with a 3rd column giving the desired symbol sizes in inches) we
lay down a world map and overlay red volcano symbols using our
custom-built volcano symbol and plot. We
do something similar with the bulls eye symbols. Without the -G
option, however, they get the colors defined in bullseye.def.
Here is our final map script that produces the Figure:
#!/usr/bin/env bash
#		GMT EXAMPLE 20
#
# Purpose:	Extend GMT to plot custom symbols
# GMT modules:	coast, plot
# Unix progs:	rm, cat
#
# Plot a world-map with volcano symbols of different sizes at hotspot locations
# using table from Muller et al., 1993, Geology.
gmt begin ex20
	gmt set PROJ_LENGTH_UNIT inch
	gmt coast -Rg -JR22c -B -B+t"Hotspot Islands and Hot Cities" -Gdarkgreen -Slightblue -A5000
	gmt plot @hotspots.txt -Skvolcano -Wthinnest -Gred

	# Overlay a few bullseyes at NY, Cairo, Perth, and Montevideo
	cat > cities.txt <<- END
	74W	40.45N	0.5
	31.15E	30.03N	0.5
	115.49E	31.58S	0.5
	56.16W	34.9S	0.5
	END
	gmt plot cities.txt -Sk@bullseye
	rm -f cities.txt
gmt end show
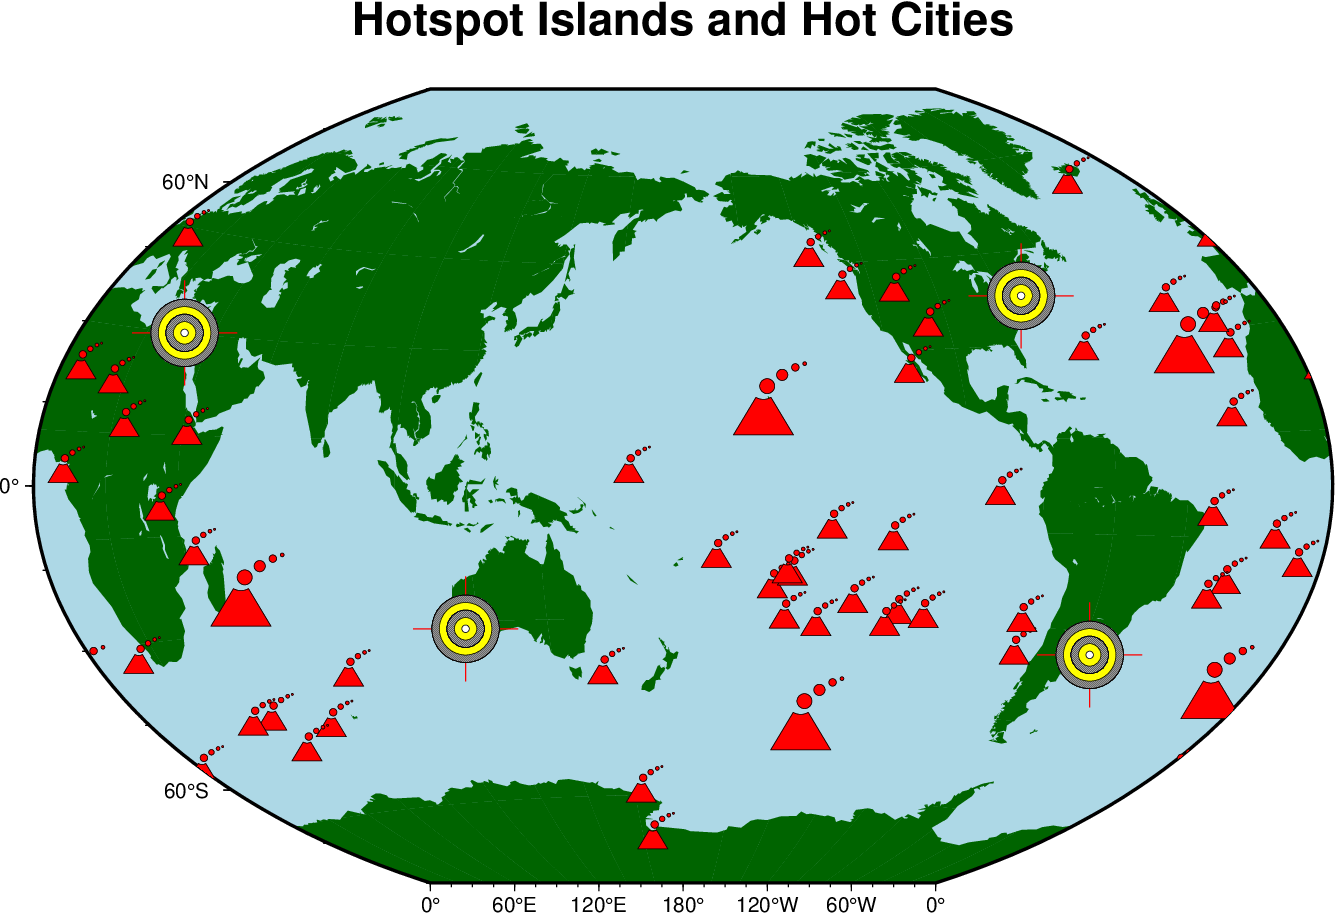
Using custom symbols in GMT.
Given these guidelines you can easily make your own symbols. Symbols
with more than one color can be obtained by making several symbol
components. E.g., to have yellow smoke coming out of red volcanoes we
would make two symbols: one with just the cone and caldera and the other
with the bubbles. These would be plotted consecutively using the desired
colors. Alternatively, like in bullseye.def, we may specify colors directly for the
various segments. Note that the custom symbols (Custom Plot Symbols),
unlike the built-in symbols in GMT, can be used with the built-in
patterns (Predefined Bit and Hachure Patterns in GMT). Other approaches are also possible, of course.